
Cross posted on the Color blog.
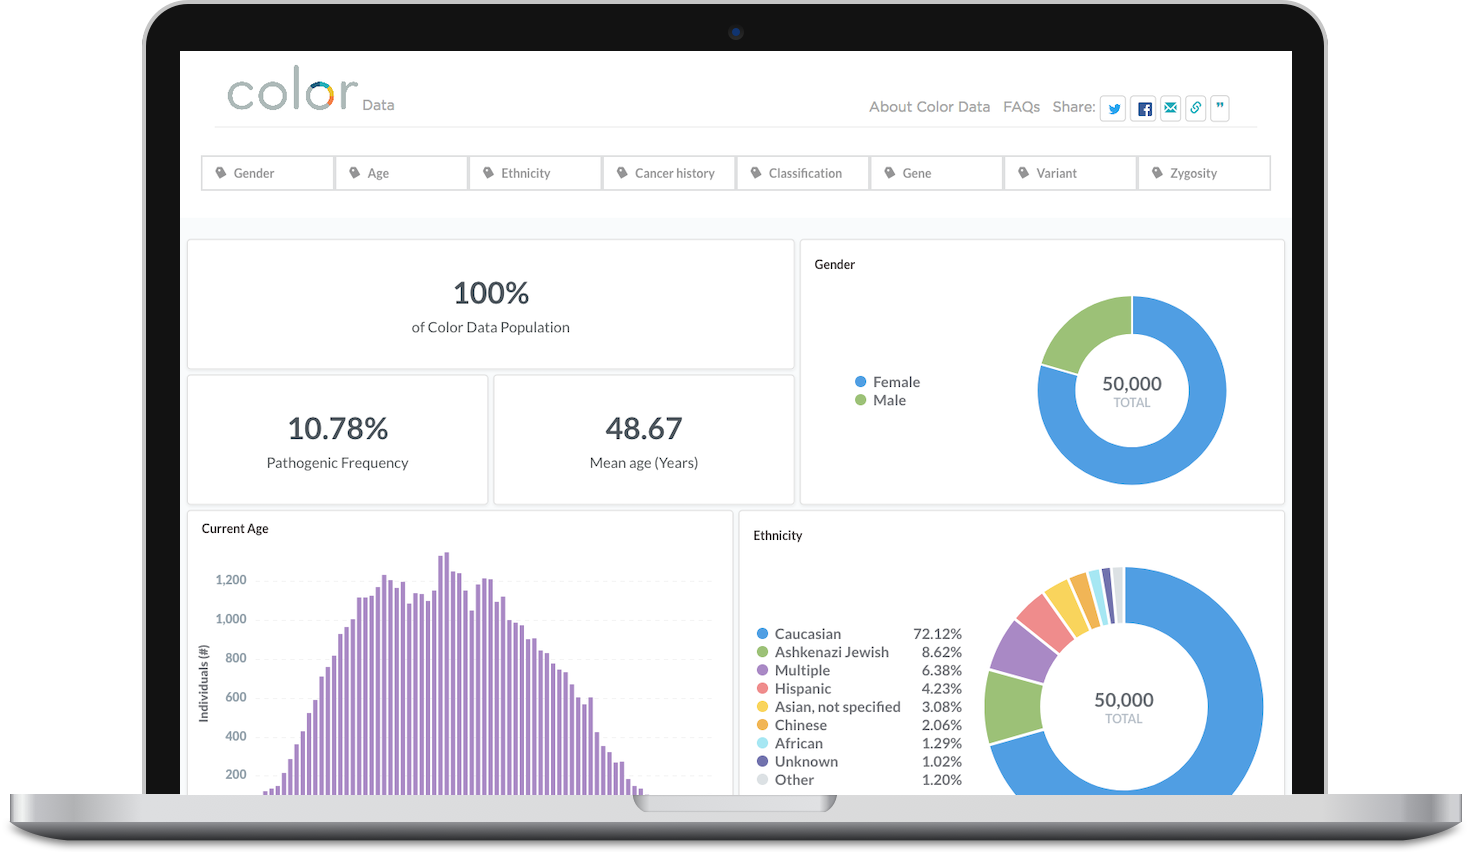
A couple months ago, we launched a public research database with DNA, health history, and more from 50,000 of our clients. You might be surprised at how little work it took us: under four person-months total. Read on to hear how we designed and built it, went above and beyond the usual privacy safeguards, and did it all in the blink of an eye.
At first glance, Color Data may seem far from unique. ClinVar, gnomAD, TCGA, 1000 Genomes, and others all address similar goals: sharing anonymized genotype and phenotype data with academic researchers to help them advance science and knowledge. We’re in an unusual position at Color, though, in that we have a large population with both sequenced DNA and self-reported phenotype that has opted to share it with researchers. Even better, our population is a bit more diverse across ethnicity, age, health history, and other characteristics than many other research datasets.
We feel strongly that participating and sharing with the genomics research community should be one of our primary goals as a company. Given that, we’ve had the idea to publish a dataset like this for a long time. We had a clear vision in our heads: elegant visualizations of genes and classifications, demographics and health history, with simple tools to filter and drill down into subpopulations.
We knew it was a substantial project, though, and as a startup, we run lean, so we never quite had the resources to spare. Extracting and preparing the data, crafting the charts and visualizations, designing and implementing an interface to drill into it…we’d need a team of multiple engineers for a minimum of a quarter, probably more like half a year.
An ounce of prevention
I was dismayed. I like to joke that I’m a Software Prevention Engineer, but I’m at least partly serious. I’m a strong believer in Peter Norvig’s maxim that All code is liability. Every line of code takes work to write, maintain, and eventually replace. Every line can have a bug, a security hole, or worse. It’s easy to think our job is to write code, but in practice, I believe our mandate is to create results. Code is our usual tool, but if we can get the same results with less code, or even none, so much the better.
![]()
“Empty Pockets,” Richie Diesterheft
So I looked around. What could we do instead? What could we reuse? It didn’t take long for Metabase to come to mind. It’s a simple, self serve BI tool that we use heavily internally at Color. It lets engineers and non-engineers alike query data, design visualizations and dashboards, and share them. We already used it to build many similar data analysis tools internally; why not this too?
Well, lots of reasons. Metabase could embed dashboards in web pages and serve them to the public, in read only mode, but we’d never tried it. We’d definitely never used it to build something with interactivity quite this deep. It had no way to implement the privacy safeguards we needed, and we didn’t know if we could add them ourselves. We had no idea how it would scale. Overall, it seemed unlikely.
Still, I was determined that we could and should spend a few engineer-months on this, cumulatively, not years. So I dove in.
I tackled the embedding first. My dream was to write a bit of static HTML, just enough to put our logo and maybe some links at the top, and then use Metabase to generate the bulk of the page. We’d avoid running a dedicated web server altogether by serving the HTML entirely from a CDN like AWS’s CloudFront. Happily, embedding Metabase was refreshingly quick and simple; I had this up and running in half an hour or so. Phew.
Spy vs spy
The next task was a big one: de-identify the data. This meant more than just removing names and other identifying details. We needed to ensure that no matter how skilled an attacker was, they’d still find it difficult or impossible to identify any individual client in the database and learn anything new about them.
Fortunately, the academic community has studied this problem deeply, and came up with techniques like statistical databases, hippocratic databases, and differential privacy. I’d even followed it myself in the past, on and off. It’s a fascinating field, and a truly hard problem. I was rubbing my hands together in anticipation at this point. Tackling a hard problem is always fun.
The simplest place to start is to allow only aggregate queries, not row level results at all. You then also need to prevent filtering down to a single row. You can do that by imposing a minimum bound on the number of rows incorporated into any aggregate operation — say, 10 — but that can be easily defeated with a query (A) that matches your target row and 10 other rows, a query (B) that matches the same 10 rows but not your target, and then simply subtracting B’s results from A.

The complexity ramps up from there. I was dismayed to find that everyone concluded it’s more or less impossible to prevent re-identification, in general, with a number of queries that scales sublinearly with both the dataset size and query restrictions. Differential privacy was a major step forward, showing adding random noise could guarantee minimal privacy levels and require a higher number of queries to determine a given amount of new information, but reduced the accuracy of results, especially for smaller datasets. Plus, when I mentioned the idea of modifying query results by small amounts to our researchers, they laughed me out of the room.
Regardless, while perfect de-identification may be impossible, there were still lots of useful safeguards in the literature that were entirely doable and provided industrial strength defense against virtually all attacks. Even better, I was able to implement almost all of them in SQL, in the Metabase queries themselves. Only a couple required me to dive into Metabase’s open source code itself.
A simple matter of programming
Next, I jumped into the ETL, the code to extract and prepare the DNA and phenotype data from the subpopulation of our clients who had opted in. We use Google’s BigQuery liberally as our data warehouse, and we’d already pointed Metabase at it, so I worked with our fearless head of data science, Gilad, to write a bit of SQL and code to find data from research-consented clients, fully de-identify their data, clean up and normalize the data, write the results to CSV files, and upload them to a new set of tables in BigQuery. It took some careful thought to ensure we applied the right filters and quality checks to the self-reported data, but fortunately not much code.
BigQuery is designed for large scale data analysis. We knew this database would fall squarely on the “small data” end of the spectrum, totaling millions of rows at most, not billions or trillions. We also hoped for this database to be highly interactive and low latency, more like an end user application, which BigQuery is definitely not designed for. Still, BigQuery was a great place to prototype. We already had an ETL harness set up to write to it.
We also made liberal use of one of my favorite BigQuery features, schema auto-detection. We changed the tables and columns and re-uploaded them over and over, and it happily re-detected the new schemas. We didn’t have to waste time updating an explicit DDL over and over.

Butt-Kicking Machine, LisaGenius
Delegate like a boss
I moved on to the dashboard itself, the visualizations and data navigation that would comprise the meat of the tool. I threw together a handful of simple tables and graphs, added parameters to let users filter by DNA and phenotype features, then showed it to our research team. They had lots of feedback. Great. I started to implement them, then quickly thought of a better option. They should implement them on their own!
One of the best ways to build something is to iterate. Try something, see how it works, identify weak parts, improve them, try again. It can take dozens of these cycles, often hundreds, to move from bad to mediocre to good to great. When the cycles are fast, that means they’re cheap, so you’re more likely to make it all the way to great before a deadline makes you stop and ship something merely good, or even mediocre.
I’ve spent much of my career identifying, analyzing, and speeding up these kinds of feedback loops. Every time I manage to do it, it pays off in spades, and this was no exception. Metabase is extremely accessible. Most of our researchers were already using it to do their own work, in various ways. They were immediately able to jump in, edit my queries and visualizations, and iterate on their own. No communication overhead, no waiting for me, just immediate gratification and flow. It worked great, and made me feel all warm and fuzzy inside.
The road to launch
I came up for air and looked around. What next? Production architecture. This would be one of our first foray into serving an end user application based on code we hadn’t written ourselves. How should we set it up and secure it?
Unlike de-identification, this was a well understood problem, and our design gave us some lucky breaks. Our ETL system meant we could put the final dataset anywhere we wanted, as long as Metabase could get to it. We originally expected we’d have to migrate from BigQuery to a more conventional relational database like PostgreSQL, but when our final Metabase dashboard threw dozens of synchronous queries at BigQuery, it responded in a few seconds at most, which felt snappy enough to end users. We happily crossed that migration off our list.
Next, security. The name of the game was mitigating risk, and the hammer I had was separating and limiting access, so I began hammering everything in sight. I moved the dashboard to its own Metabase instance on a separate EC2 instance, security group, and VPC. I moved the BigQuery tables to their own Google Cloud project, created a dedicated service account for Metabase to use, and made sure that service account couldn’t access any of our other Google Cloud resources or data. Lastly, I put the HTML files in a dedicated S3 bucket and CloudFront distribution, separate from our other buckets and distributions.

Color Data: cancer onset age histogram
At this point, we had a working site and database. We shopped it around internally, gathered feedback, and iterated. I threw together some ugly HTML, CSS, and social sharing buttons. I even wrote a few bits of JavaScript to get individual queries into Google Analytics so we could see how people used the database.
Victory lap
Everyone loved it. Business development people started using it to pitch potential customers. Genetic counselors drilled into it to understand specific niches in our population. Our PR people especially liked it; they pitched it to GenomeWeb, which ended up publishing a thoughtful, clear-eyed take on it that got a lot of traction. We even wrote a research paper and submitted it to Database: The Journal of Biological Databases and Curation, and good news: they’ve accepted it!
Our research team announced the database publicly at ASHG this year to a standing room only crowd. We’ve heard a lot of interest and positive feedback from all over. More importantly, we’re seeing a growing amount of usage by real people using the database to get real insights out of our population.
My favorite result of all, though, is the software we prevented and the work we avoided. I worked on the database for four months or so, spending roughly half of my time on it. Our intrepid genetics researcher Cynthia Neben also worked hard on it for much of that time, spending maybe a cumulative a month or so total, including at least 10–20 hours politely nodding at my bad jokes. Gilad spent another week or two on data normalization and ETL.
A number of other people helped in invaluable ways, but when you add it all up, we still invested well under two person-quarters total. That’s way less than the multiple person-years we originally estimated it would take to build it from scratch. Even better, the only code we have to maintain is some static HTML and CSS and a few small Metabase pull requests. Score one for software prevention!
If it’s not already obvious, I had a ball building Color Data. I got to prototype an unconventional idea, iterate quickly with amazingly smart people, dive deep into a hard research problem, and deliver something that’s valuable to the research community at large. And as a bonus, my family and friends can try it too!
If this sounds interesting, we’re hiring! Drop me a line any time, I’m always happy to talk about Color.
Mentions