
![]()
It’s been a year since I last looked at Bridgy usage stats, so here’s an update!
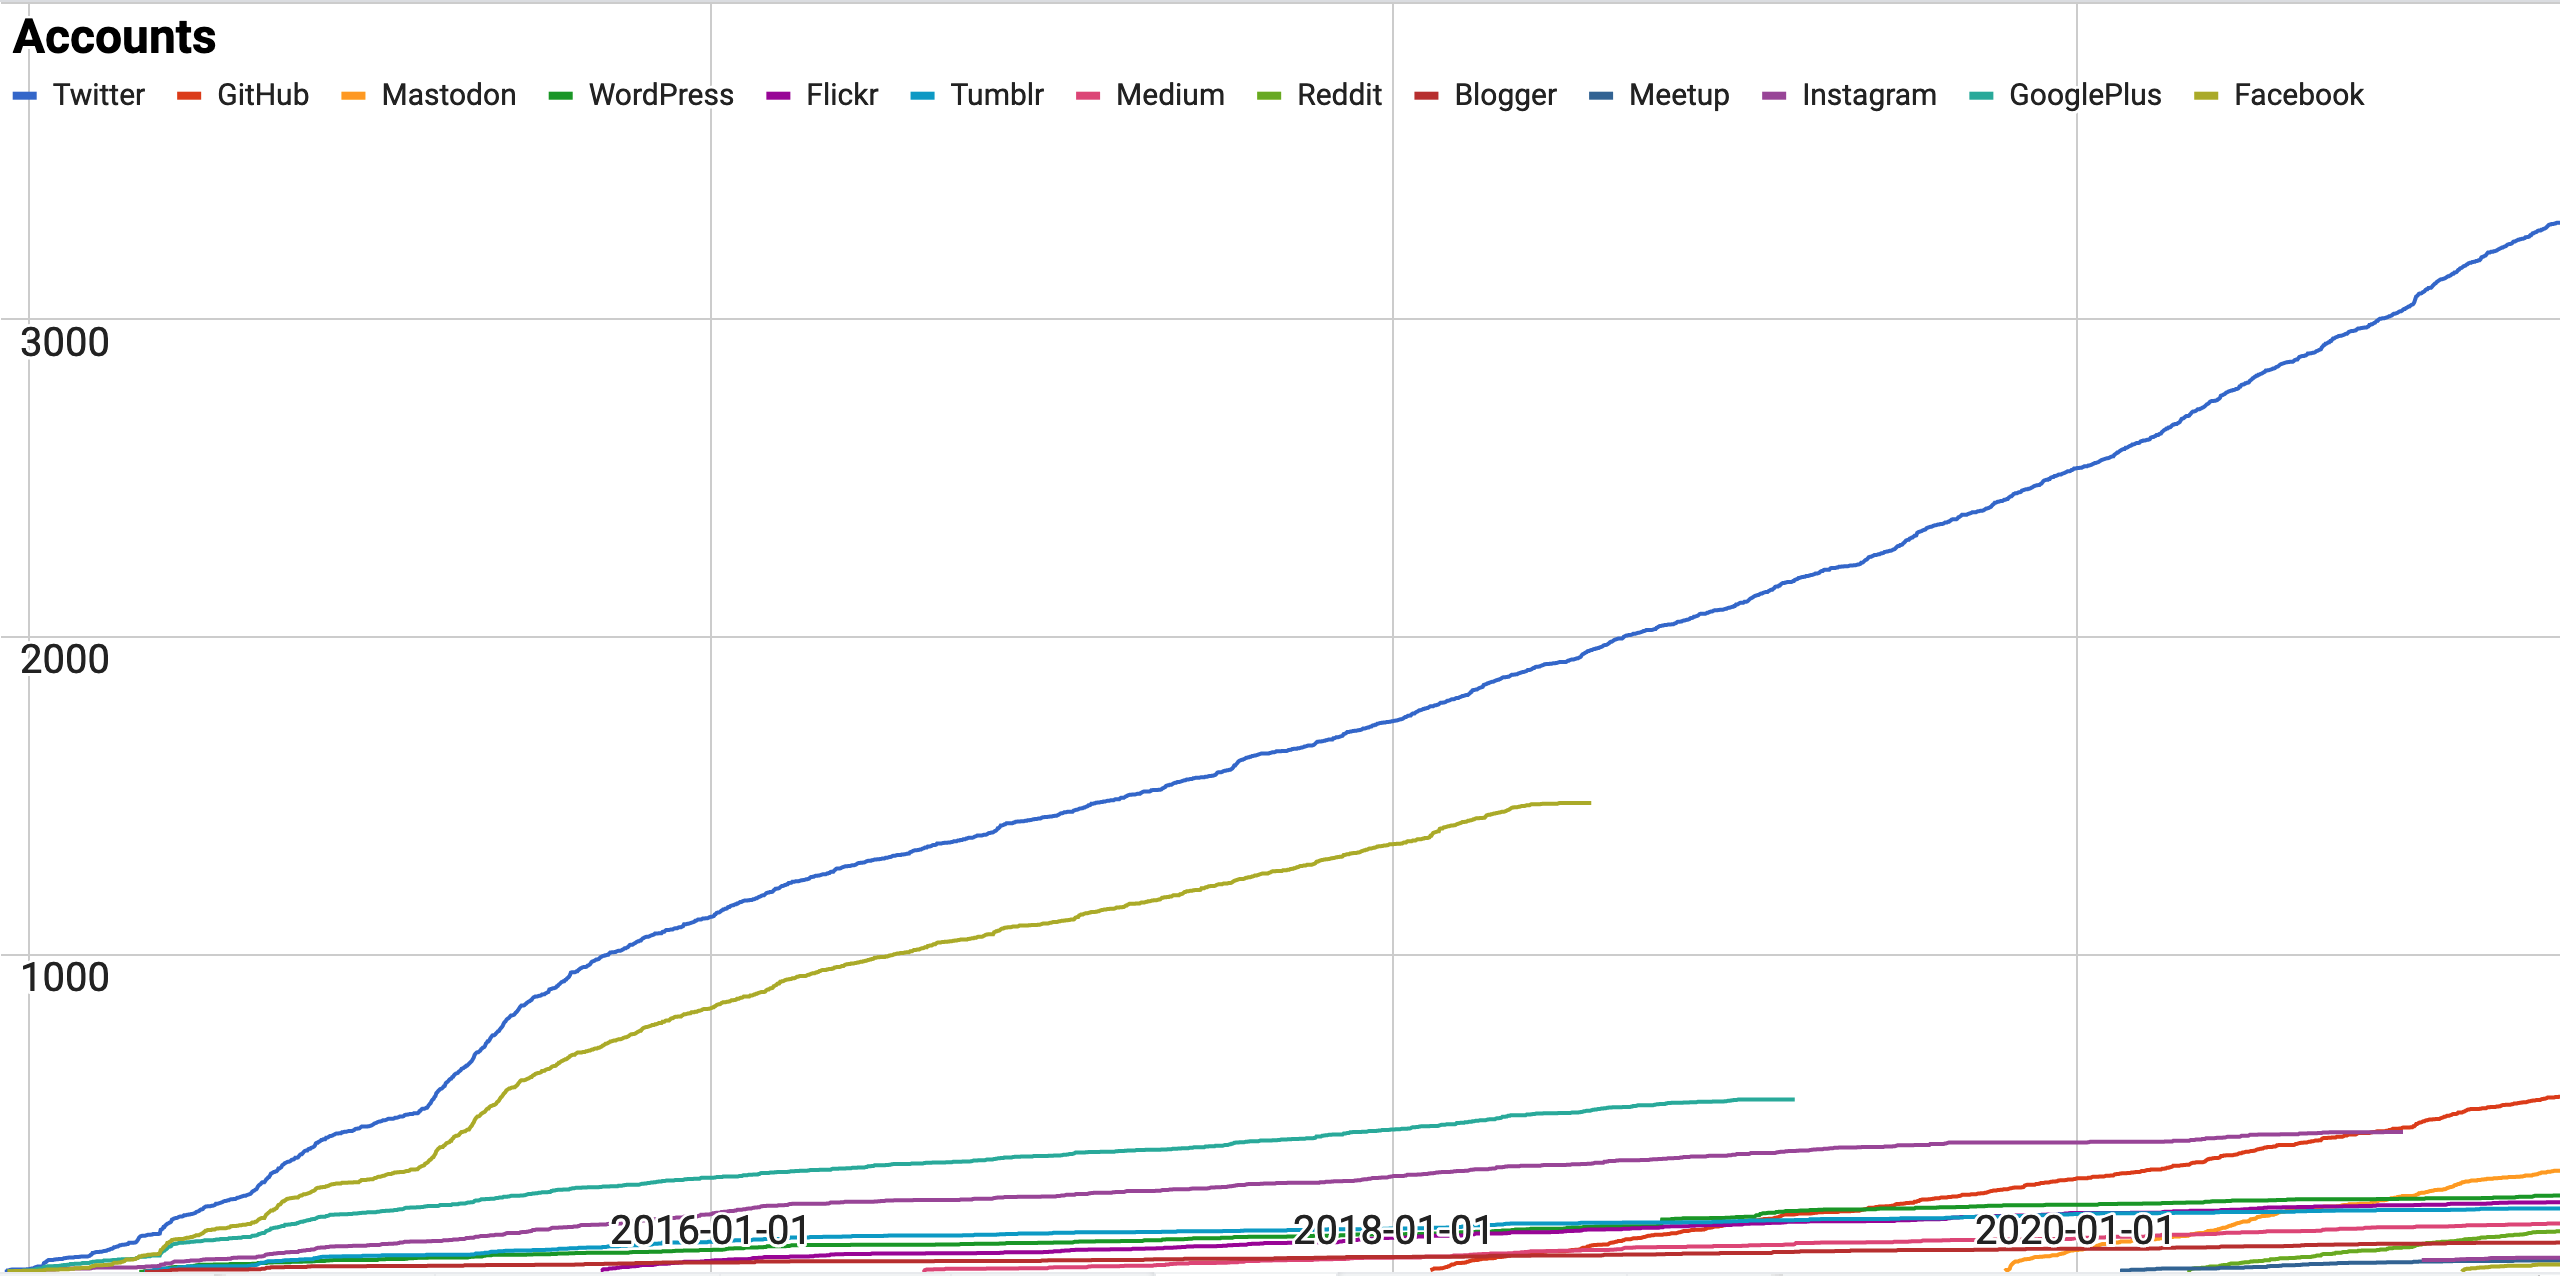
The most noticeable event since last year is that Instagram finally blocked our server side scraping for good. We quickly launched a browser extension for both Instagram and Facebook, which is working well, but meant we had start to all over again with adoption and growth. Ah well, silos gonna silo.


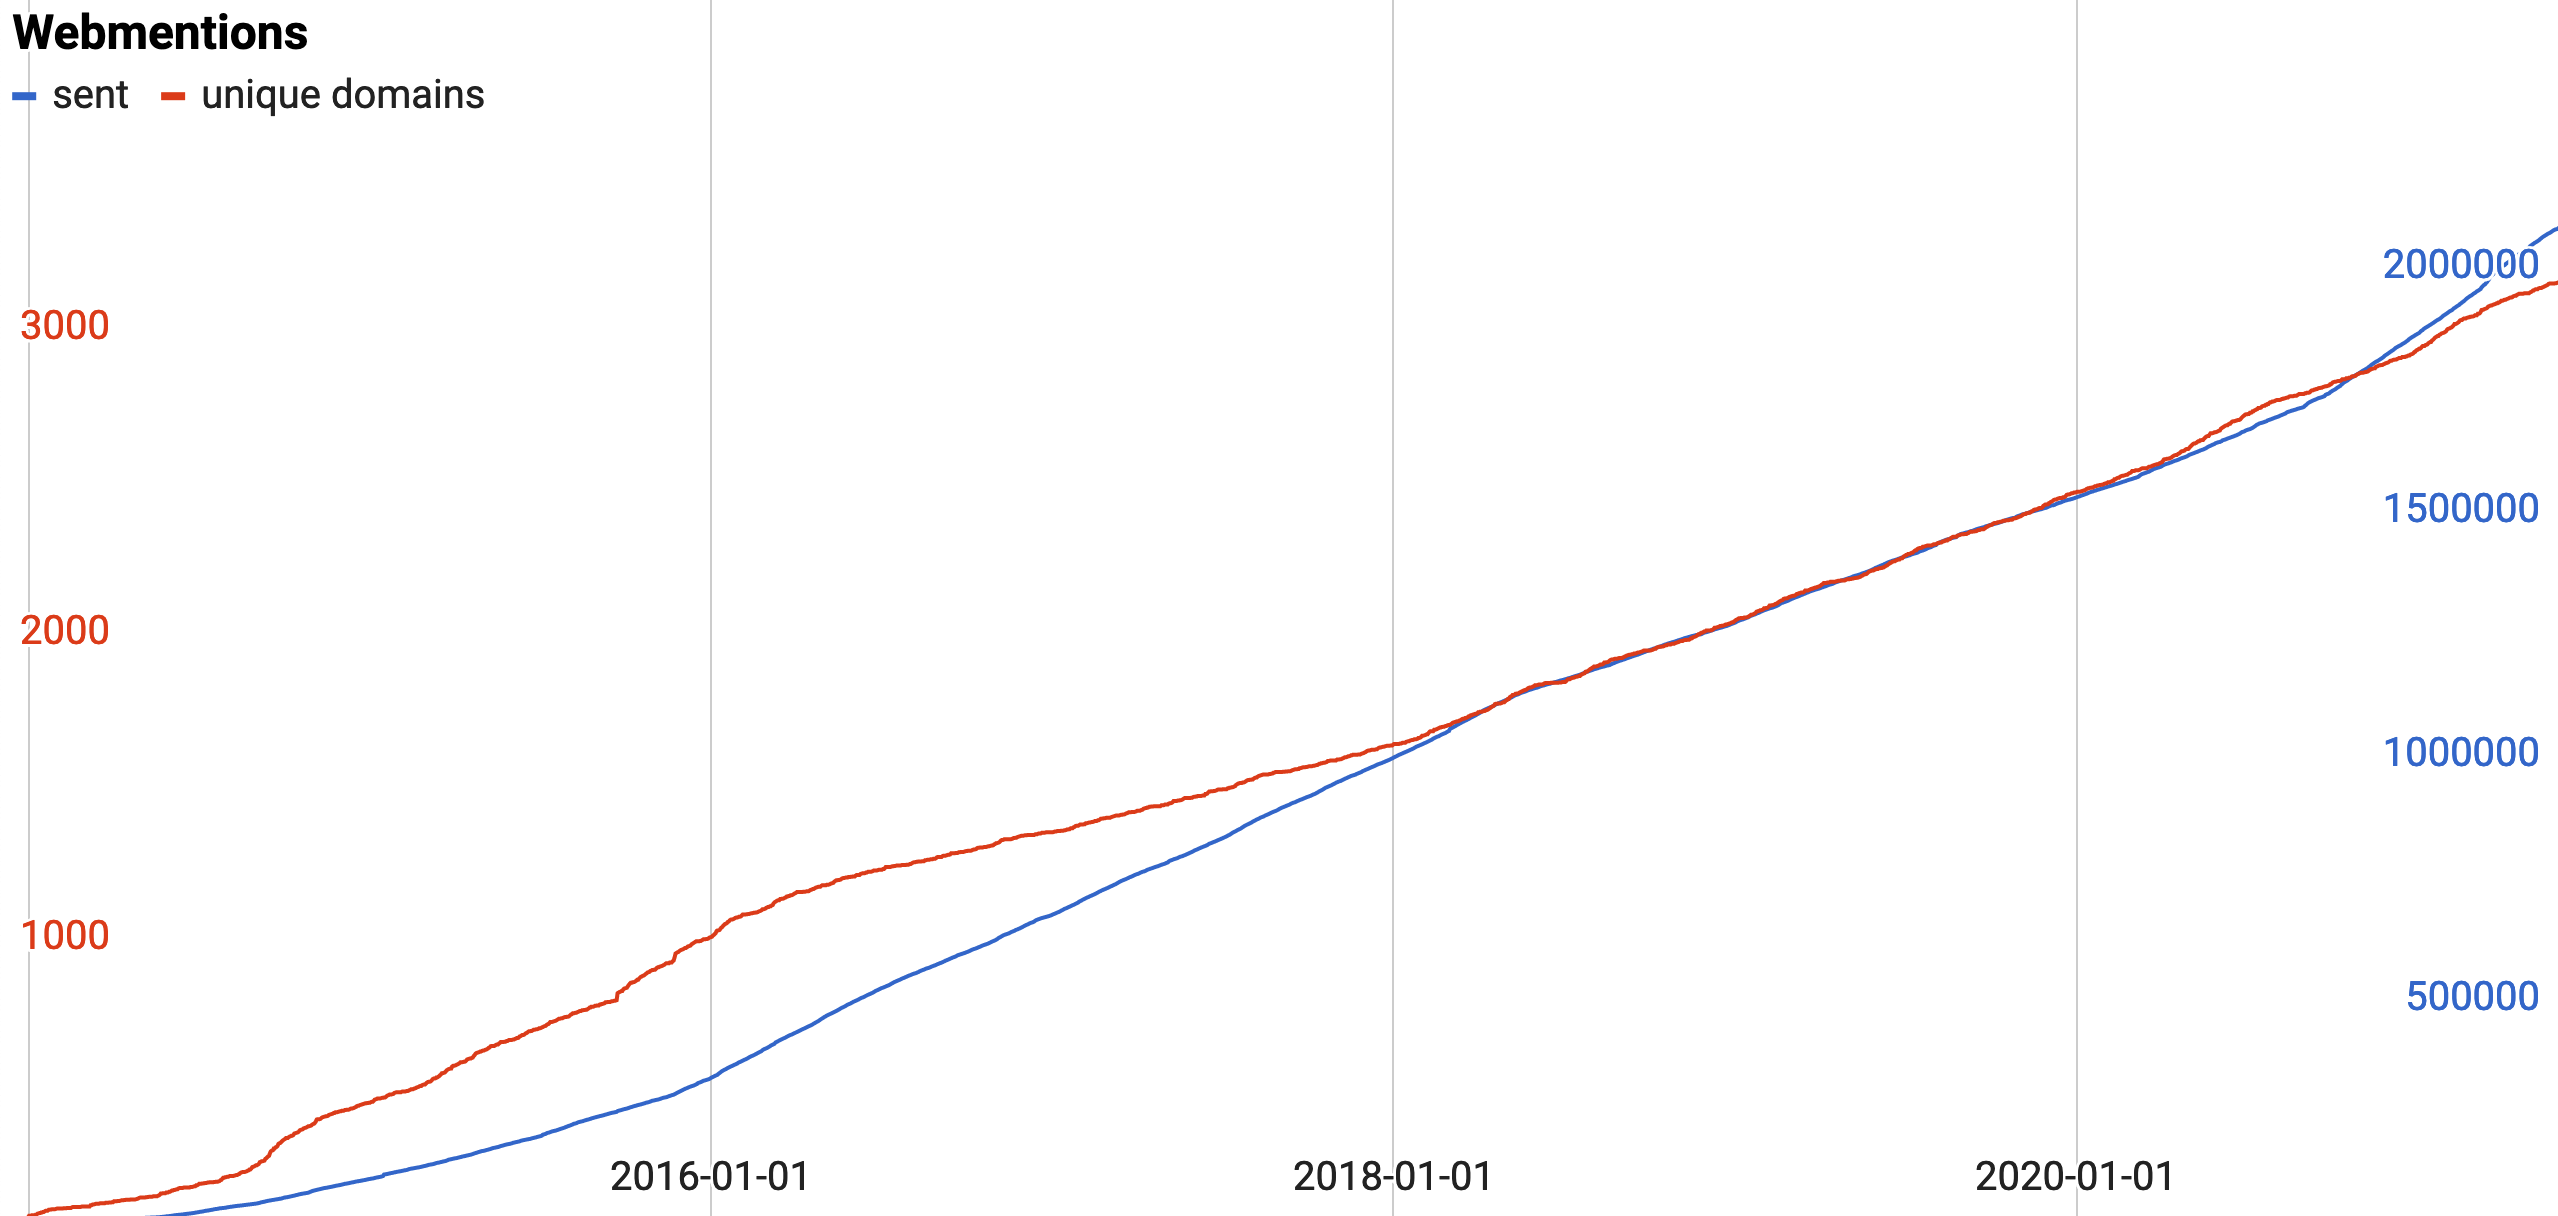
We also hit another webmention milestone: over 2M webmentions successfully sent. Congrats!
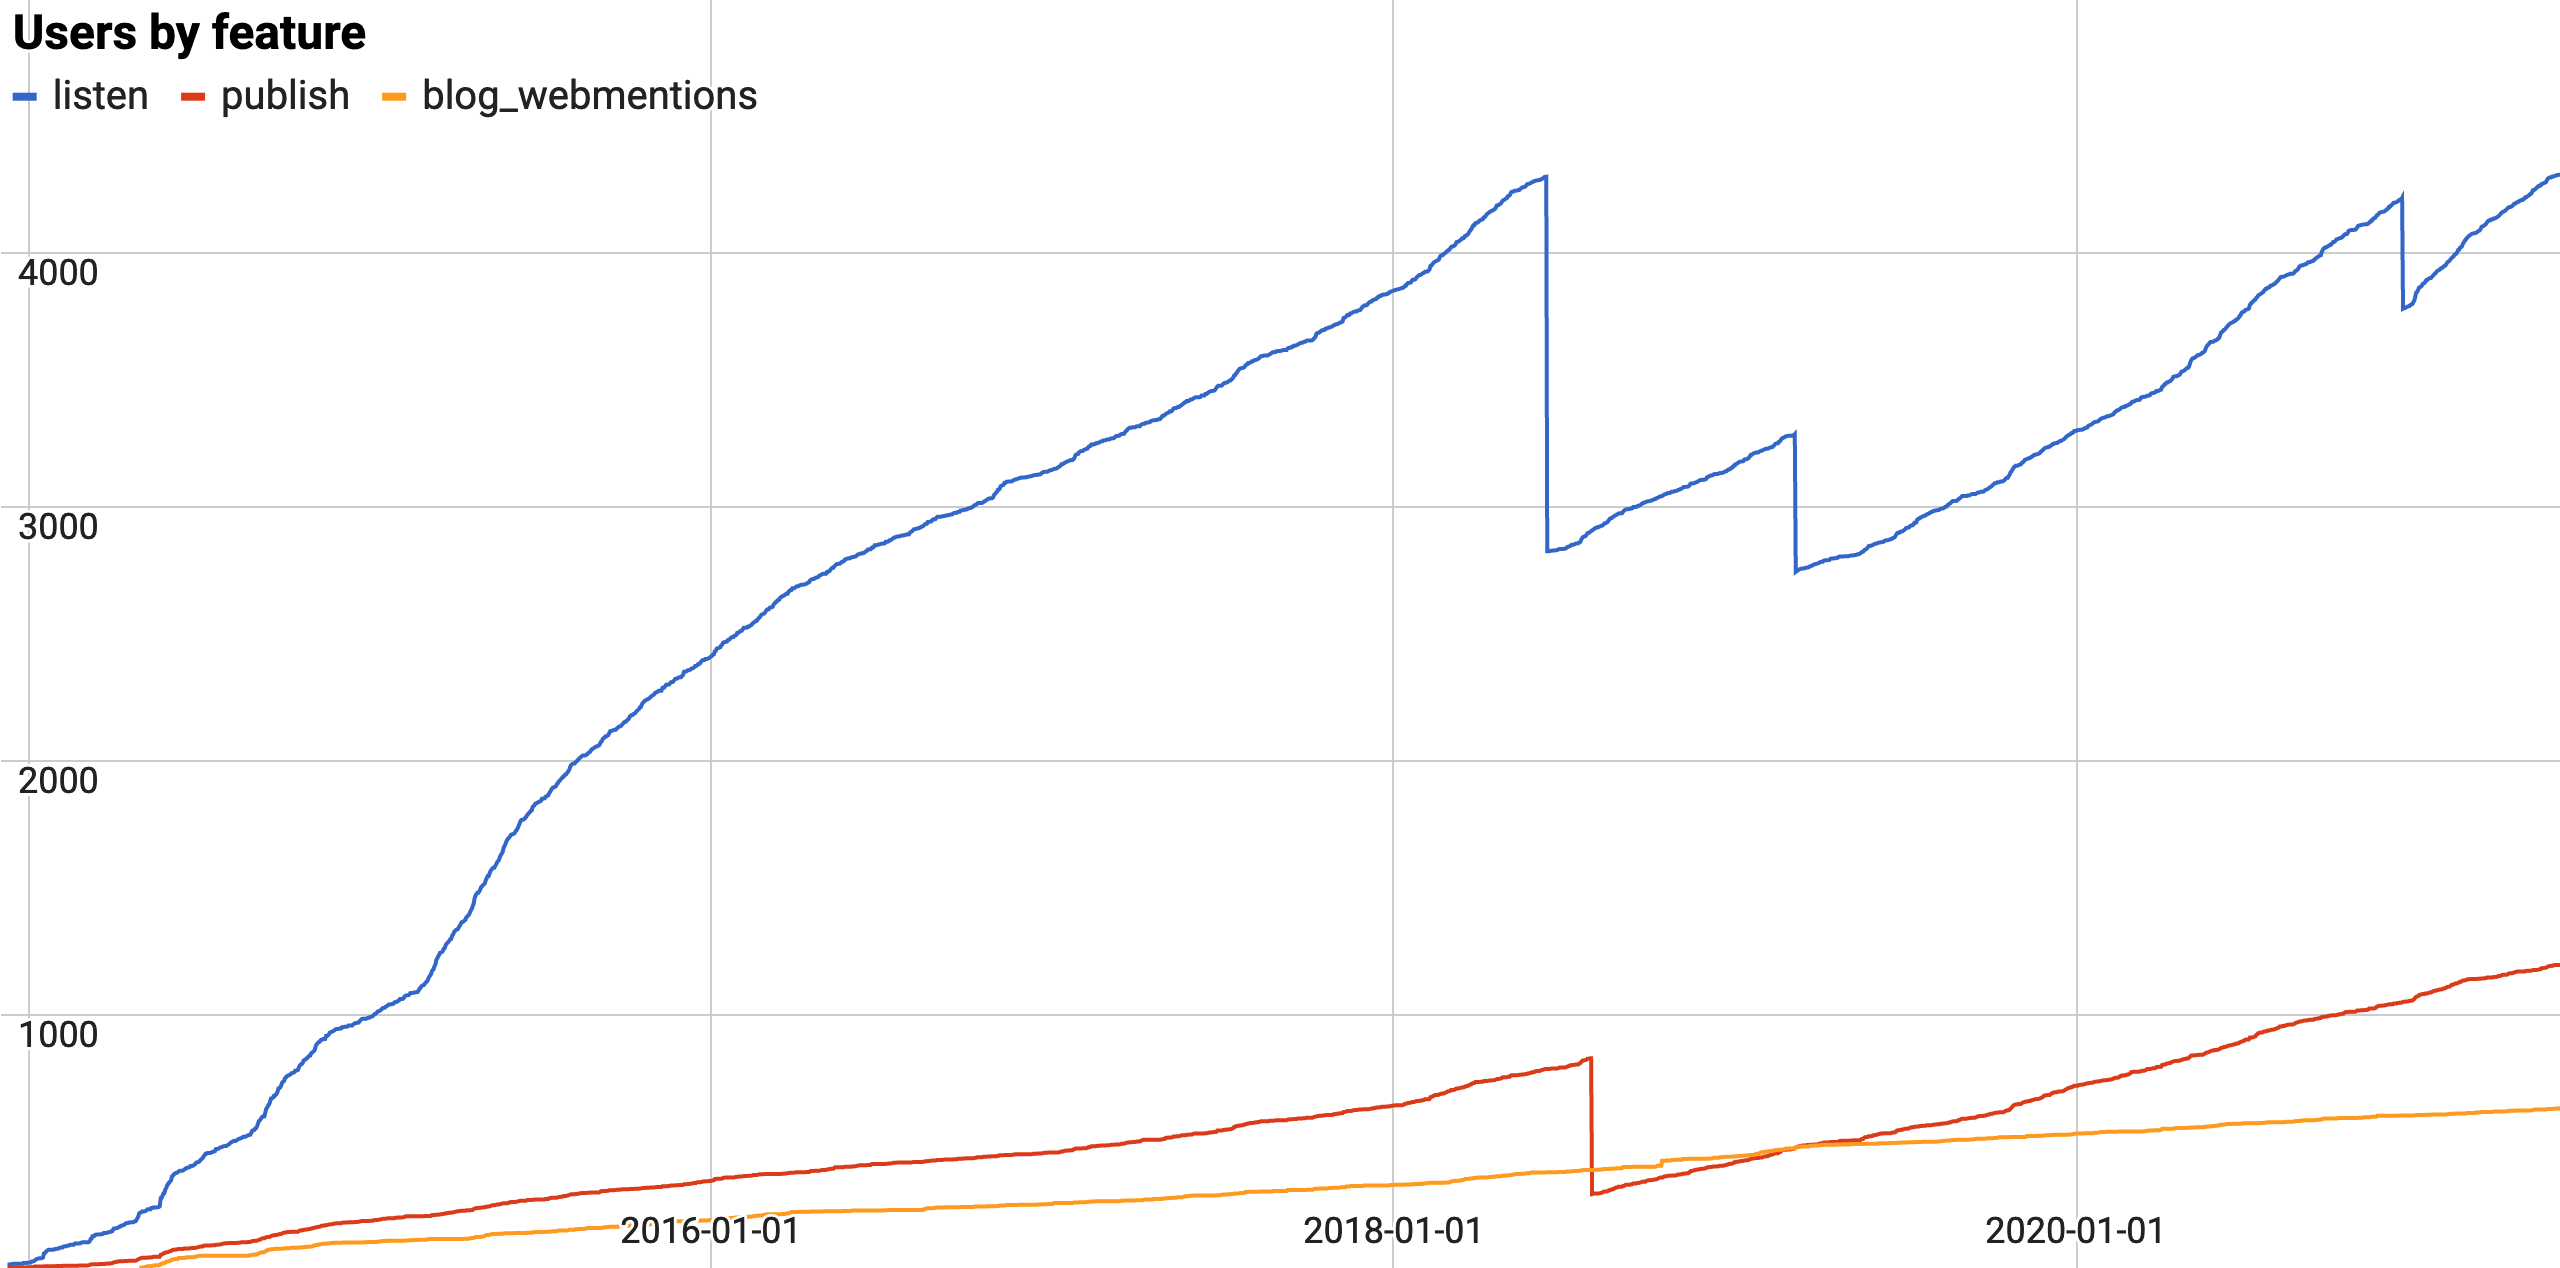
One interesting mystery is the sudden drop in publish growth in September 2020. Before then, we were seeing steady exponential growth in the number of posts published, peaking at almost 8k per month in August 2020. That suddenly dropped to less than 2k per month by October, and has stayed there since. No clue why. Anyone have any ideas?
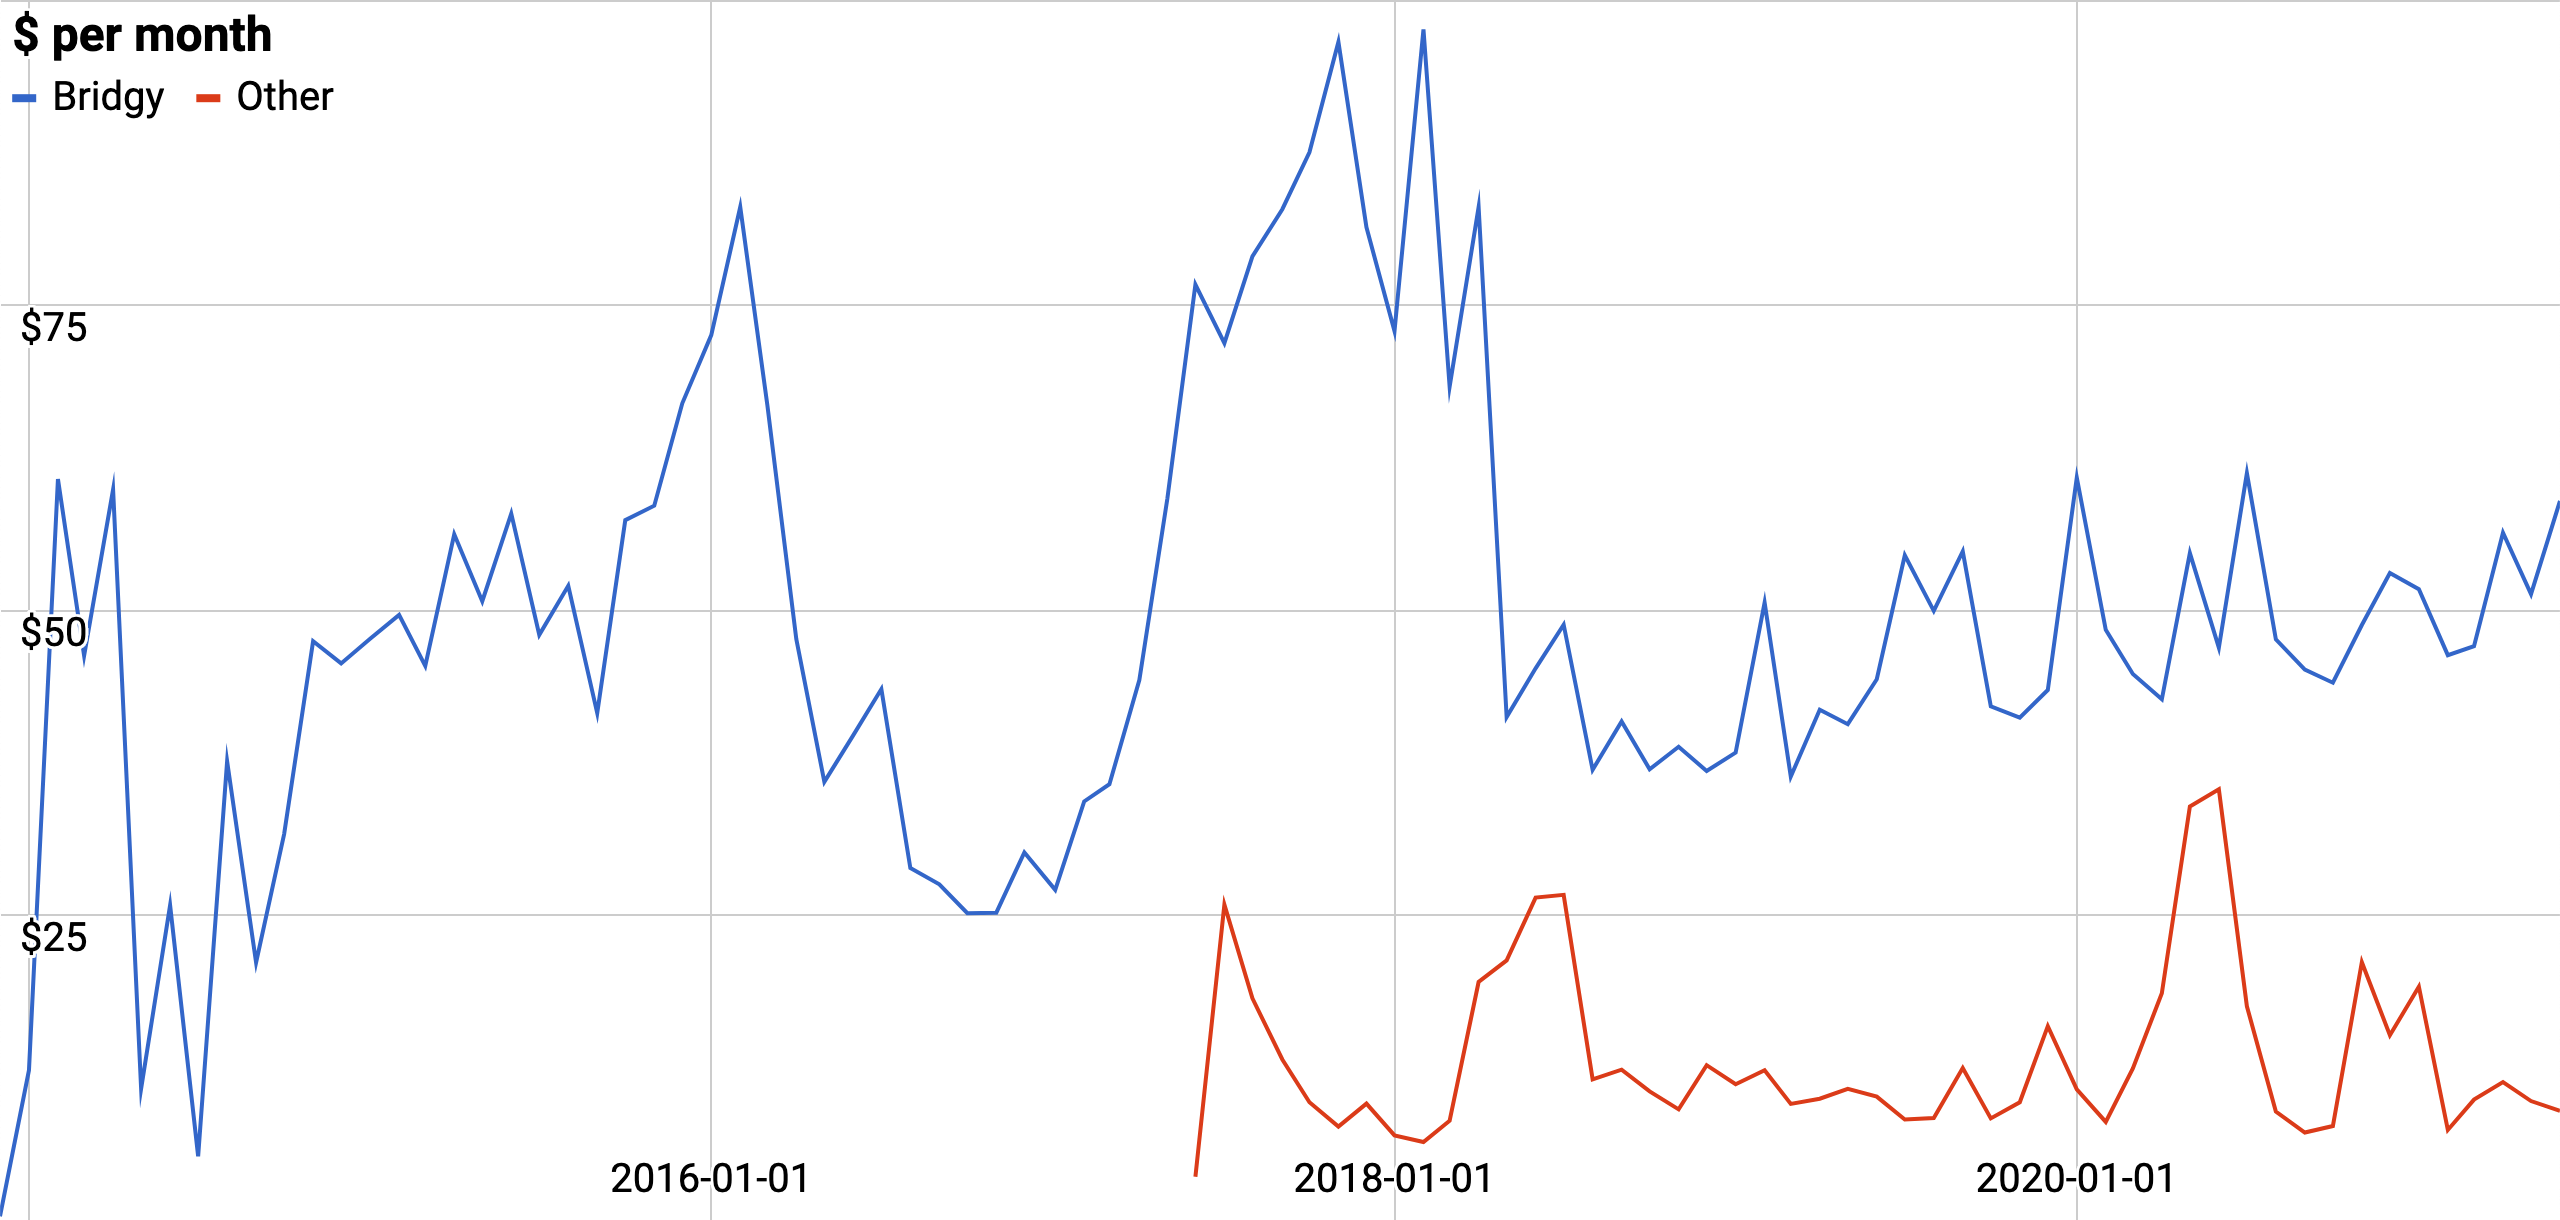
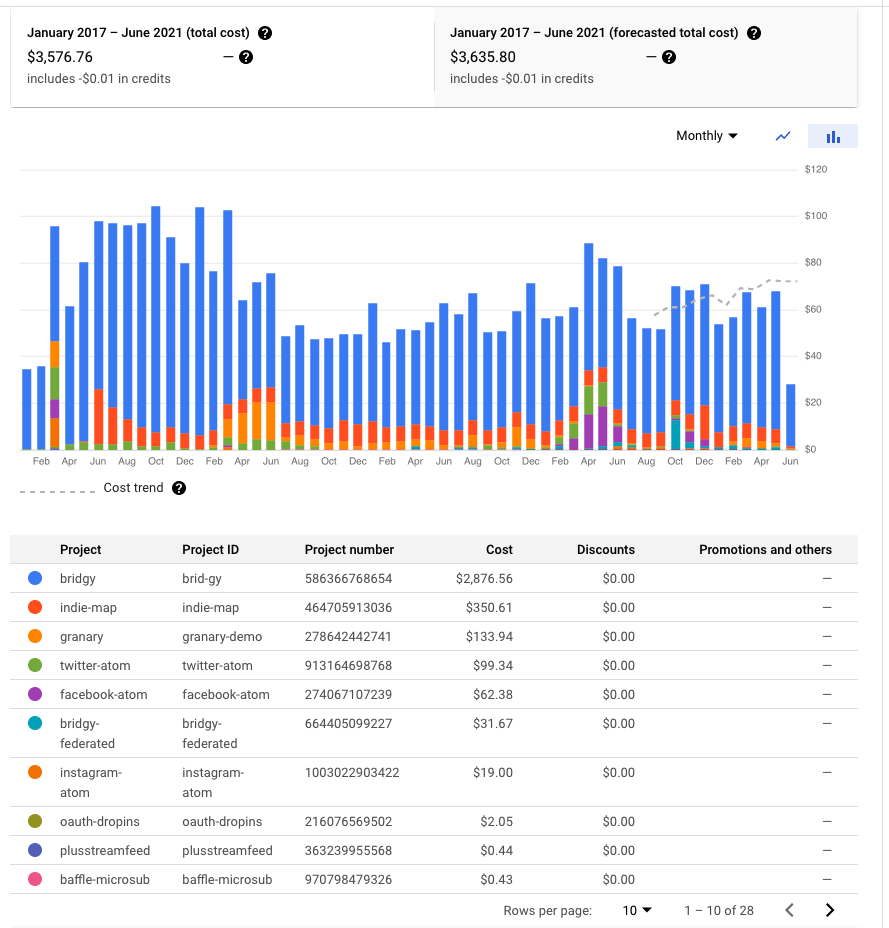
Otherwise, growth continues apace, up and to the right. Costs too. 😁
Data, methodology, previously, previously, previously, previously, previously, previously.
I wonder if the drop-off in publishing after August 2020 might be due to pandemic fatigue.
Hmm, maybe, interesting idea! Definitely possible…but it seems a bit sudden for that. I’d expect to see that as a more gradual shift, but the change in the shape of the curve in August is really noticeable and sharp.
Thanks for the info and insightful stats. About the rising costs; I would personally be fine with sending brid.gy a modest monthly support for keeping the service going, especially as I totally rely on it for my publications to Twitter and Mastodon. Any way you think is cool?